Performance testing an API
Note: This post was written in 2017 using Locust 0.x. Modern Locust (1.x+) uses
HttpUserinstead ofHttpLocust, the@taskdecorator instead ofTaskSet, and is installed viapip install locust. The concepts still apply.
APIs are everywhere!
APIs are another way in which customers can access our service. It allows customers to customize their use of our service, integrate it into their own products and generally use it in ways that we might not have thought of. If we did not have an API, and only offered a UI we might be limiting our customer base to only those who are able to use the UI and are satisfied with the features we offer in the UI. More and more services are offering APIs as first class options, alongside UIs.
With an API comes the need to performance test it. The API is a service that is being used by customers and we need to ensure that it is able to handle the load that is being put on it. If the API is slow, customers will not be happy. If the API is down, customers will not be happy. If the API is not able to handle the load, customers will not be happy.
There are several good tools that can help you performance test an API. I’ve used JMeter, Locust and a wee bit of Gatling. Locust has become my go to tool for all recent performance testing work.
Why Locust?
Ease of use
Locust is really easy to use. You can get started with a simple script that you can write in a few minutes. It’s really easy to get started and have a working performance test running with Locust.
Open source
Locust is open source. The code is available to you! Say you’re working on a project and that turns out to need more than what Locust offers out of the box. What now? If you know a bit of Python or are willing to dig in and learn, you can look at the code and make your changes! If it’s something that might be universally useful, you just submit a pull request and there’s a good chance it will get added into the product itself.
Python based
Everything in Locust is Python based. Your tests get written in Python, the entire codebase of Locust is Python based etc. So if you already know Python - Locust is going to be piece of cake.
Lightweight
Locust is extremely light weight and can be run on your personal machine to generate pretty high loads on the target machine. I’ve sometimes run into a limitation while using JMeter, which is Java based, where it ends up taking my personal machine down while trying to generate high enough loads to load the target machine.
Sample Code
I like to read a little intro and then right away look at code. This article is written that way as well, here’s a simple code example.
from locust import HttpLocust, TaskSet

def login(l):
  l.client.get("/login", verify=False)

def index(l):
  l.client.get("/", verify=False)

class UserBehavior(TaskSet):
  tasks = {index:2, login:1 }

class WebsiteUser(HttpLocust):
  task_set = UserBehavior
  min_wait = 5000
  max_wait = 9000
I’ve defined a class named UserBehavior that (as the name suggests), models the user’s behavior. In this case, there are two tasks that the user does
- hit the index page, represented by the index() function
- hit the login page, represented by the login() function
If you look closely, the variable tasks contains the list of tasks that are to be run as part of the performance test and also the relative frequency at which to run them (or weight). The index task is run twice as frequently as the login task. The power of this is immense - you can simulate user behavior where the user searches 10 times and then checkouts 1 item, for example or logs in, does 10 different tasks and logs out etc as part of every test.
The min_wait and max_wait are set to 5000 and 9000, which means each simulated user will wait between 5 and 9 seconds between the requests.
Launching
Where to start? Right here - just follow the below steps.
First, set up the environment. These steps create a Python virtualenv for you to play around in and get Locust installed:
pip install virtualenv
virtualenv perftest
source perftest/bin/activate
pip install locust
Then, copy the Python code from earlier in this article to locustfile.py and start Locust:
locust -f locustfile.py --host <your apps url>
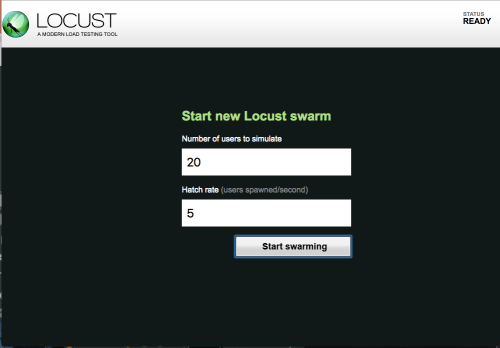
Here’s what the results look like:


You know now that your app supports 20 concurrent users, hitting the app at the rate of 3 new requests per second - without resulting in any failures. You can keep increasing the rate of new users and the total number of concurrent users until you see failures - if you want to find out your system’s limits.
Additional Ideas
Suppose you have a library that someone has built around your REST API. That means it’s really simple to interact with the API now but you’re not able to use the requests library directly and thus Locust does not know if a request failed or passed, how long it took etc. What do you do now?
Luckily, the folks at Locust thought about everything. You can use event hooks to manually report success or failure. Here’s an example where we call a custom wrapper function and then tell Locust the result:
auth_status = testCase1.custom_check_using_wrapper_overREST(auth_res_txid)
total_time = int((time.time() - start_time) * 1000)
if auth_status == 'allow':
        events.request_success.fire(request_type='https', name='enrollpushapprove', response_time=total_time, response_length=0)
else:
        events.request_failure.fire(request_type='https', name='status_not_allow', exception='auth_status_not_allow')
We ran a function named custom_check_using_wrapper_overREST that wraps a REST API call, then used its return value to tell Locust whether the request was successful or not. Locust has these powerful event hooks that allow you to write up such tests.